Our year in numbers
Some statistics at a glance.
Our community
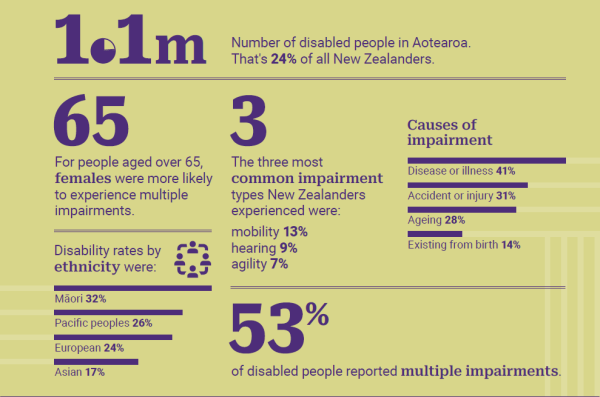
- 1.1 million - number of disabled people in Aotearoa
- 24 percent of New Zealanders.
- For people over 65 years, females were more likely to experience multiple impairments.
- The three most common impairment types New Zealanders experience:
- Mobility - 13 percent
- Hearing - 9 percent
- Agility - 7 percent.
- Causes of impairment:
- Disease or illness - 41 percent
- Accident or injury - 31 percent
- Ageing - 28 percent
- Existing from birth - 14 percent
- Disability rates by ethnicity:
- Māori - 32 percent
- European - 24 percent
- Pacific peoples - 26 percent
- Asian - 17 percent
- 53 percent of disabled people reported multiple impairments
Our people
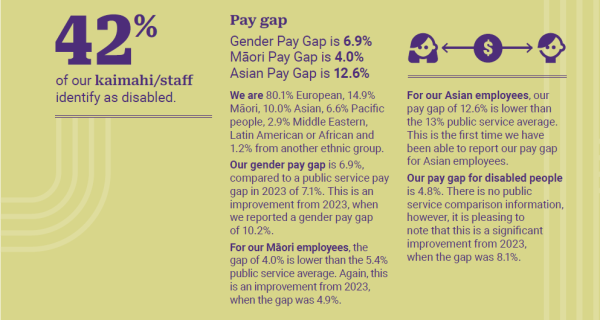
- 42 percent of our kaimahi/staff identify as disabled
- Pay gap:
- Gender pay gap is 6.9 percent
- Māori pay gap is 4.0 percent
- Asian pay gap is 12.6 percent.
- We are:
- 80.1 percent European
- 14.9 percent Māori
- 10.0 percent Asian
- 6.6 percent Pacific people
- 2.9 percent Middle Eastern, Latin American or African
- 1.2 percent from another ethnic group.
- Our gender pay gap is 6.9 percent, compared to a public service pay gap in 2023 of 7.1 percent. This is an improvement from 2023, when we reported a gender pay gap of 10.2 percent.
- For our Māori employees, the gap of 4.0 percent is lower than the 5.4 percent public service average. Again, this is an improvement from 2023, when the gap was 4.9 percent.
- For our Asian employees, our pay gap of 12.6 percent is lower than the 13 percent public service average. This is the first time we have been able to report our pay gap for Asian employees.
- Our pay gap for disabled people is 4.8 percent. There is no public service comparison information, however, it is pleasing to note that this is a significant improvement from 2023, when the gap was 8.1 percent.
Our services
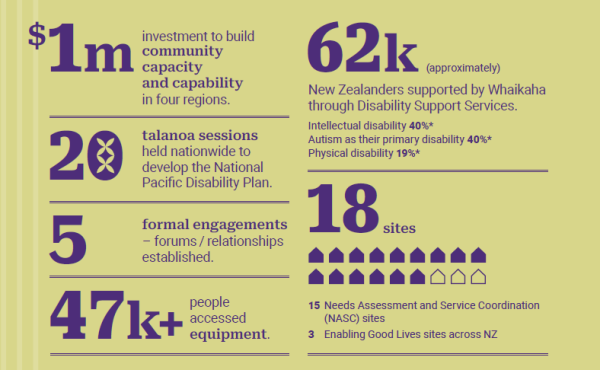
- $1 million investment to build community capacity and capability in four regions
- 20 talanoa held from Kaitaia to Invercargill to develop the National Pacific Disability Plan
- 5 formal engagements - forums / relationships established
- 47,000+ people accessed equipment
- 62,000 (approximately) New Zealanders supported by Whaikaha through Disability Support Services:
- 40 percent have an intellectual disability
- 40 percent have autism as their primary disability
- 19 percent have a physical disability
- 18 sites across New Zealand:
- 15 Needs Assessment and Service Coordination (NASC) sites
- 3 Enabling Good Lives sites
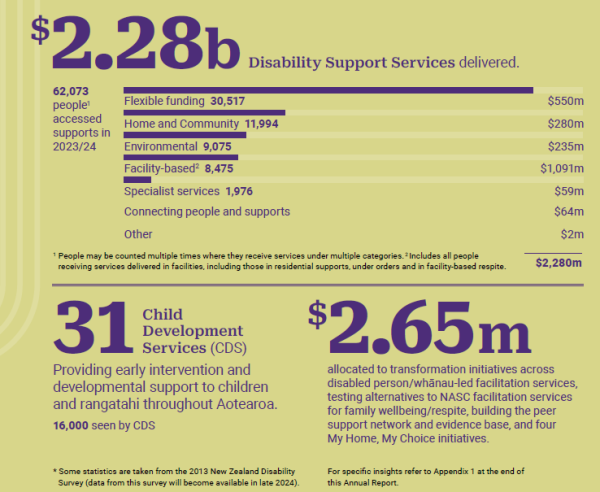
Number of people who accessed supports in 2023/24:
|
Support type |
People1 |
$ |
|---|---|---|
|
Facility-based2 |
8,475 |
$1,091m |
|
Home and Community |
11,994 |
$280m |
|
Flexible funding |
30,517 |
$550m |
|
Environmental |
9,075 |
$235m |
|
Specialist services |
1,976 |
$59m |
|
Connecting people and supports |
|
$64m |
|
Other |
|
2m |
|
Total |
62,073 |
$2,280m |
1People may be counted multiple times where they receive services under multiple categories.2Includes all people receiving services delivered in facilities, including those in residential supports, under orders and in facility-based respite.
- 31 Child Development Services (CDS) in Aotearoa
providing early intervention and developmental support to children and rangatahi. 16,000 seen by CDS - $2.65m allocated to transformation initiatives across disabled person/whānau-led facilitation services, testing alternatives to NASC facilitation services for family wellbeing/respite, building the peer support network and evidence base, and four My Home, My Choice initiatives.