Appendix Five: Pacific disability dashboard
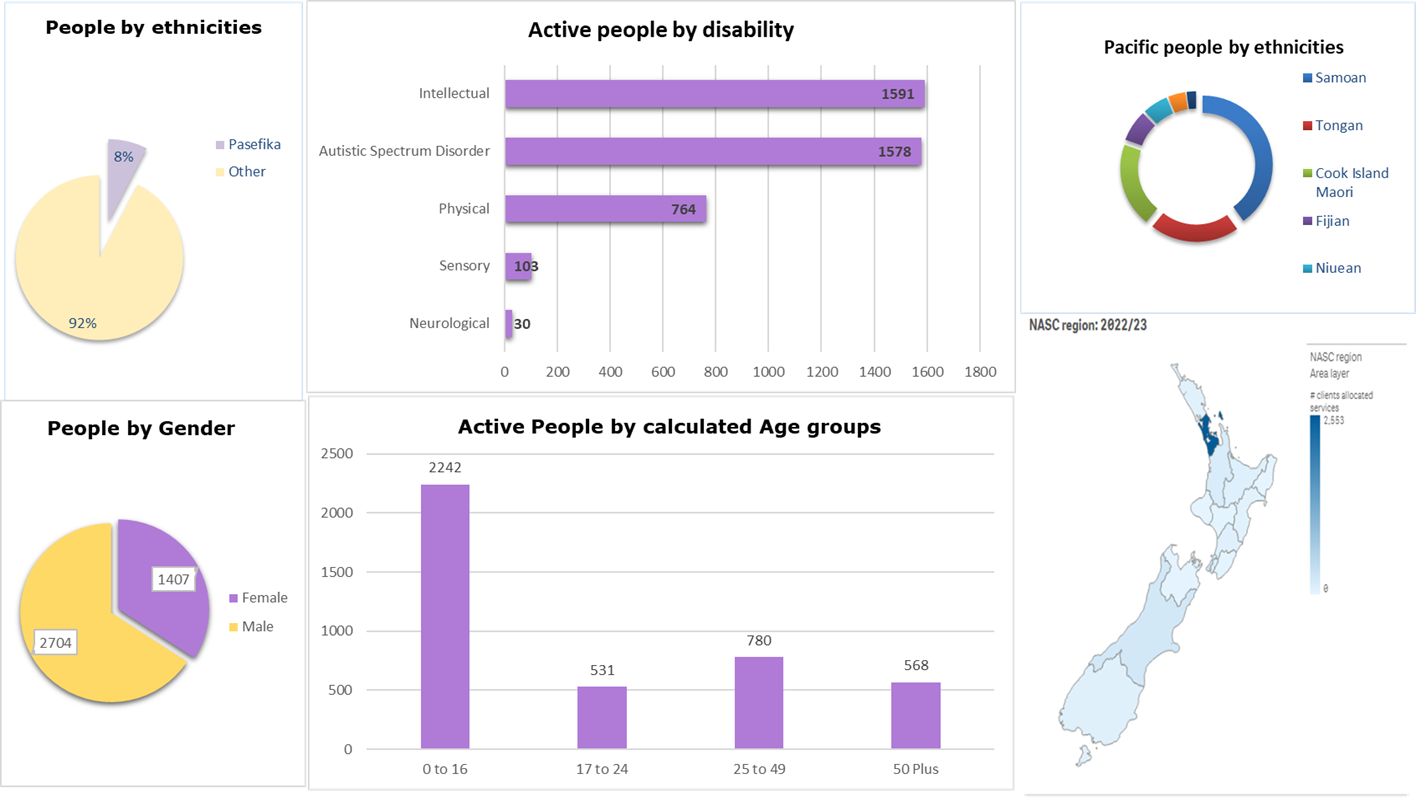
There are six tables included in the dashboard.
- Table one is a pie graph titled “Active people by gender”. There are a total 2704 females to 1407 males receiving Disability support services.
- Table two is a pie graph titled “People by ethnicities”. Pacific disabled people account for eight percent of the population in receipt of disability support services.
- Table three is a column graph titled “Active people by Disability” with five columns, Intellectual disability - 11591, Autism Spectrum Disorder - 1578, Physical -768, Sensory - 103 and Neurological - 30.
- Table four is a column graph titled “Active people by calculated age groups”. Age group 0 to 16 - 2242, 17 to 24 - 531, 25 to 49 - 780 and 50 plus - 568.
- Table five is a pie graph titled “Pacific people by ethnicities”, illustrating the 3 leading ethnicities receiving Disability support services being Samoan, Tongan and Cook Island.
- Table six is the NASC (Needs assessment service coordination) for the year 2022/23. The image highlights New Zealand, depicted in shades in light blue to dark blue. The image illustrates that the Auckland region has the highest concentration of Pacific disabled people receiving disability support services.